
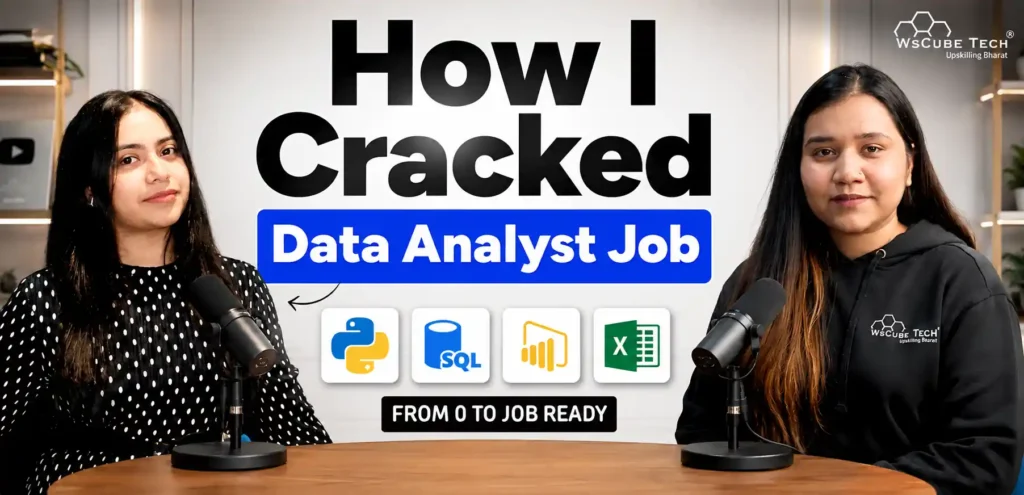
Nandini Athwani, a learner from the WsCube Tech Data Analytics Course, transitioned from a pharmacy background to a career in data analytics, landing her first role as an Operations Analyst at Stockverse, a US-based stock trading company, just months after completing the program.
In this in-depth interview, she shares her career switch, learning routine, projects, interview experience, the tools that helped her get hired, how she uses AI in her day-to-day work, and her advice for freshers starting a career in Data Analytics.
Key Highlights of the Interview
In this interview, Nandini shared her journey related to:
- Career switch: Biology to Pharmacy to Data Analytics to Operations Analyst
- First interview, first offer: This was Nandini’s first-ever interview, and she got selected.
- Role: Operations Analyst supporting a 20-person sales team at a US stock trading firm.
- Core tools: Advanced Excel, SQL, Power BI, Python, and AI.
- Daily work: Mostly data cleaning, organizing large sales/enrollment/payment datasets, and building Power BI dashboards.
- Interview focus: Excel case tasks, basic Power BI questions, and strong communication.
- AI at work: Uses AI to generate query logic, understand APIs, and speed up dashboard work.
- Advice: Be consistent, focus on projects, and don’t fear starting from zero.
Watch the Full Interview
What does Nandini’s journey from Pharmacy to Data Analytics really look like? Watch her full interview to find out.https://www.youtube.com/embed/sRnHGS1XpzM?si=uLmDHARdcuxSefj7
Student Highlight
| Attribute | Details |
| Name | Nandini Athwani |
| Course | Data Analysis Course |
| Background | Biology student (switched to Pharmacy) |
| Current Role | Operations Analyst |
| Company | Stockverse (US-based stock trading company) |
| Key Tools | Advanced Excel, SQL, Power BI, Python, AI |
| Work Focus | Data cleaning, reporting, dashboards for a 20-person sales team |
| Interview Outcome | First interview (selected as Operations Analyst) |
Nandini’s Background: Why a Pharma Student Chose Analytics
Nandini started as a biology student and later moved into pharmacy. While exploring career options, she realized that staying only in pharma might limit her growth in an increasingly AI-driven job market. She noticed that fields like clinical research already handle large datasets, and she wanted a role where she could work directly with data and visualization. That’s when data analytics clicked as the right path.
Recommended Professional
Certificates
Nandini’s Reasons for Choosing Data Analytics and WsCube Tech
Nandini chose data analytics because:
- It’s a high-growth, high-paying field with strong future demand.
- It connects with her domain knowledge (pharma/clinical research deals with data).
- She genuinely enjoys visualizing data and turning raw numbers into insights.
She joined WsCube Tech’s Data Analysis Course to get structured, beginner-to-advanced training in:
- Advanced Excel
- SQL
- Power BI
- Python and AI
Coming from a non-tech background, she appreciated the step-by-step path from basics to advanced topics.
Skills and Tools She Worked On
During her 5‑month program, Nandini focused on:
- Advanced Excel: Data cleaning, complex formulas, charts, basic forecasting.
- SQL: Querying, filtering, and transforming data efficiently.
- Power BI: Building interactive dashboards, choosing the right charts, adding filters/dropdowns.
- Python: From basics to advanced, though she found this the most challenging.
- AI: Using prompts to generate logic, understand APIs, and speed up analysis tasks.
She put extra focus on SQL, as it made her data cleaning and extraction much faster.
No Tech Background? Start Exactly Where Nandini Started
Nandini came from Biology and Pharmacy. She had never written a formula in Excel or a query in SQL before joining.
The Data Analytics Course at WsCube Tech teaches every tool from the very basics, which is exactly why the switch worked for her.
What the 18-week program includes:
- 106+ hours of live classes across 5 milestones, starting from Excel basics
- The full toolkit: Advanced Excel, MySQL, Power BI, Tableau, Python and Pandas
- AI built into every module, including prompt engineering, AI assisted SQL, and automation with n8n and Make.com
- 10 projects and case studies on real company data from Amazon, Swiggy, Myntra, Tata Power and Apollo
- Mentors from Microsoft, Amazon, Google, KPMG and Rapido
- A 4-week internship as a Data Analytics Intern at WsCube Tech
- Bonus modules in statistics, machine learning, Microsoft Fabric and Google Analytics 4
No coding background needed. You start from zero and build up, the same way Nandini did.
Experience: From Learning to Real Work
Nandini completed around 6 to 8 course projects, mostly in Excel and Power BI, and submitted them on time. These projects gave her:
- Real-world context for messy datasets
- Confidence to explain her work in interviews
- A portfolio she could reference when interviewers asked about projects
She says projects were especially important for her because she was shifting from a medical/pharma background into IT, and they helped her prove she could handle real data tasks.
Responsibilities of Nandini as an Operations Analyst
At Stockverse, a US-based stock trading company, Nandini supports a 20-person sales team. Her key responsibilities include:
- Data cleaning & organization: Handling large, messy sales, enrollment, and payment datasets.
- Reporting: Preparing weekly and monthly performance reports using advanced Excel and Power BI.
- Dashboards: Building Power BI dashboards to visualize sales performance, conversions, and top performers.
- Tracking & insights: Monitoring conversions, identifying top performers, and highlighting trends for leadership.
Most of her day goes into data cleaning and structuring; dashboarding and meetings happen on a weekly/monthly cadence.